What is breadth trading?
If you just follow one single stock or a sector, it is extremely likely that you will be whipsawed. Because at any given point in time there will be "some" sector or "some stock" that is going against the entire market trend. Hence, to reduce further whipsaws, you should inculcate "breadth trading".
Instead of just following one stock or sector, follow the bullish/bearish signs across ALL the sectors. One single stock or sector can never move the entire market. It needs some company. Hence, the bottom line is that there ought to be at least 2-4 sectors that are "outperforming" other sectors.
How do you figure out breadth? You can always just monitor ALL the sectoral ETF's on a carpet. OR, you could use Bullish percentage index on StockCharts.com.
BP as it is referred, is a culmination of ALL the bullish Point and Figure charts for a specific sector/index.
For example, $BPSPX is S&P 500 Bullish percentage index. What that means is, it shows how many stocks in S&P 500 are showing bullish Point and figure charts. Point and figure charting is completely different from candlesticks and you can read more about it on stockcharts.com itself. What we are trying to address here is "breadth".
If BP rises and continues to do so, it is undoubtedly a confirmation that the trend is UP. If BP is NOT rising or struggling hard, that literally means MORE stocks in that umbrella are broken beyond repair and are unable to reverse their course.
Always check BP for confirmation of whether a specific move is being supported by the entire market participants or not. Market markers can pump ES/futures/spy and move the market if they like, but if there is NO support behind them, then market will go nowhere but where the majority is.
Put it in simple terms. Just because you have the BEST soccer player in the world in your team doesn't mean you will always win. Why? At the end of the day you would need support from ALL the other players to make it happen. Likewise, just because one stock or sector makes new highs doesn't mean it will take the entire market to new highs.
Breadth trading is something that i learned the hard way. And am very comfortable sticking to it.
Very simple explanation of BP, can be found Here.
GLTA
Wednesday, July 21, 2010

Tuesday, July 20, 2010
July 20 EOD Update

In all our earlier updates, we have been showing this inverse chart and stating how bearish things are. Today, we thought let us for once hear out our friend Bulls and use the Bullish case instead.
The above is a "go long" chart and is inverse to what we present all the time.
As you can see, we are just making lower highs and lower lows here. Indicators are mostly balanced out as there are divergences on both sides of the coin. Negative as well as positive.
Since today's action was "extreme", we do expect some sort of follow through tomorrow. But we still are sticking to our theory of 1000 and below before we even try any attempt at 1100. Stocks do NOT just rocket higher without first creating a) divergence and/or b) higher highs (if it were to move even higher).
In our case, we have NEITHER at this time. Hence, our case of 1000 and 950 still stays strong. Today was a "dream come true" for all those who either wanted to go short or were able to play the "massive" swing by closing shorts early in the day and then going short again at EOD. :-)
Not ignore the "bulls", most of our indicators have turned neutral now, as opposed to extremely bearish. What follows through in the coming days will dictate which way we end up.
GLTA
Monday, July 19, 2010
July 19th EOD Update

Once again, a very lackluster day. Nothing really changed as you can see from the above chart. Still short and strong. All we did was cycle back some of the extreme oversold conditions on hourly charts. As you can see from the above chart, we even have not yet BEGUN diverging. Which means there is a Looooooooooooooong way to go (down that is).
Stay put. Unless something changes on the above chart, and explicitly stated on this blog, it is safe to assume we are still LONG all of our portfolio of ES short (1088), FAZ, DRV, SDS and TZA. All of them bought between 12 and 14th of July.
PS: Stay tuned guys, a BIG move is coming to the downside. We will take out 1000 and even 950 shortly.
GLTA
Friday, July 16, 2010
How is our Indicator doing?

We have been SHORT since ES 1070 and 1098. Just browse through our blog and you will see each and every day we have been strongly advocating Shorting for the last 4 days. 12th morning is when we started shorting and are currently sitting on a neat profit on all of our holdings, namely, ES, FAZ, DRV, SDS and TZA.
Is this story over yet? Without going into the technicals or macro-economics, just simply look at the above chart. We are clearly making Higher Highs and Higher Lows on this chart. Which means we are going to make a lower low than what we recently did on SPX.
Also note that the PACE of this advance/decline has been on the rise. Look at the angle of the first higher high line and the second one. BOTH, the duration AND Pace has increased. This is owing to the underlying volatility.
Bottom line is, We are going to make a NEW high and that NEW high will probably be dictated by the upper TL from the recent high that is parallel to the new lower TL with higher degree.
Things will clear out sometime in the next 7-15 days.
PS: I see a lot of folks saying that we are oversold and that things just don't go straight in a line and that we will see some upside moves. Since i just go with the above chart, all the ups/downs is noise to us. Unless the above chart tells us, we don't trade otherwise. The above chart has successfully tracked the Last to up/down moves ranging from 7-10% moves.
Adding to the above. A great analogy is "Climbing Stairs". When you are climbing, it takes a whole lot of effort for you to climb up. Climbing down the stairs is always with lesser effort and MUCH faster. Likewise, for all those who believe that we won't go down faster, please at a minimum have Strict Stop loss in place.
GLTA
Have a nice weekend
Thursday, July 15, 2010
Investing is nothing more than going to Las Vegas?

Yes, it is NOT just limited to US equity markets. I mean, what story could possibly fit in this chart? In just 3 trading sessions, investors thought an entire Japanese market was great place to park their hard earned money into. And within that timeframe itself, they decided to pull out of it???
And yes, this is NOT just one single stock with 1% move. This is an entire index we are talking about and that has risen nearly 3.5% and LOST ALL of it, within 2 trading sessions.
Welcome to the BIGGEST Ponzi scheme this world has ever seen.
How you trade in this kind of a market, go figure...
Did i mention. Nobody on this planet can trade this through any kind of study, fundamental/technical/TL's etc.
Good luck with that...
Captain America for the rescue... Yeehaa

What else can i say...
Just one thing...
If you are short... Continue to be. Check out "Our Chart". Nothing really changed. We just hit a minor resistance. We will continue our descent faster and sooner than anyone can think of.
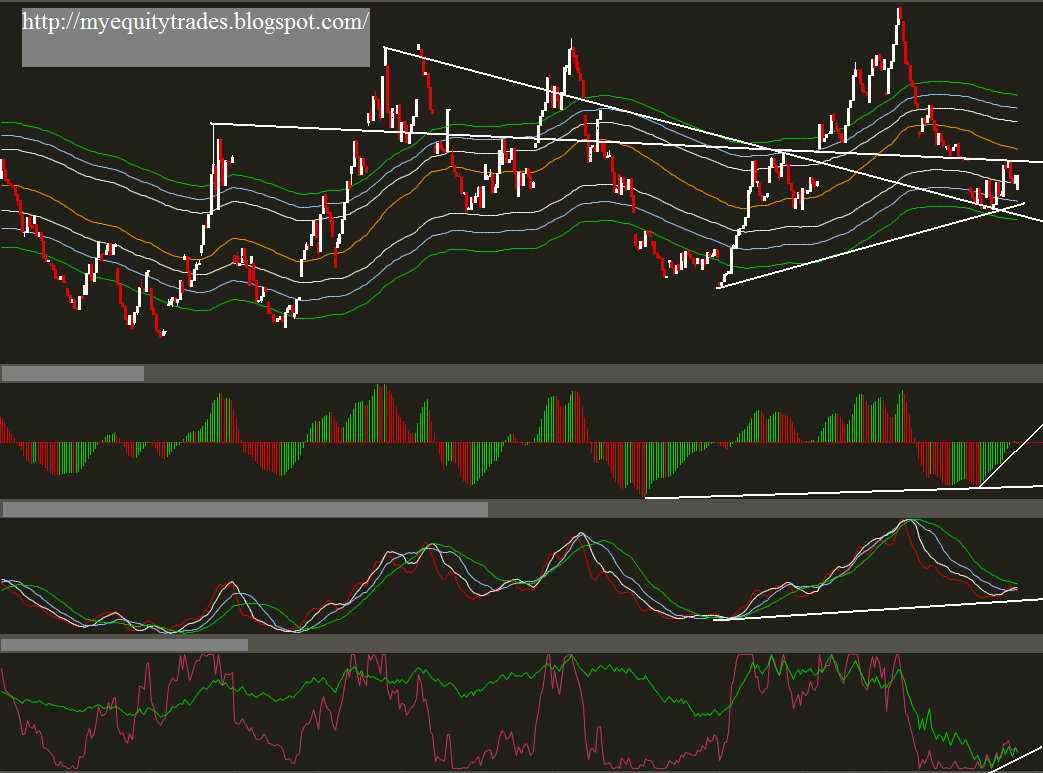
Stay put.
GLTA
Wednesday, July 14, 2010
How is our Indicator doing?

It's been a while we posted our indicator. This is the SAME indicator that suggested to go LONG on the 2nd july.
This SAME indicator is NOW clearly flashing SELL signals. As you know, this indicator is an Inverse and hence if it is a BUY, you short and vice versa.
As stated in our earlier post, we are either already in the next leg down or very close to beginning one. Looking at our divergence charts, we are now clearly in one. So, a confirmation is in place.
Divergence chart that we mentioned earlier is doing just great as you can see below. Pretty much self-explanatory.

GLTA
Subscribe to:
Posts (Atom)
